I primarily have two portfolios: EPF Portfolio and Personal Portfolio (codename: Freedom).
This page will be a simple one-pager that primarily focuses on my personal "freedom" portfolio from various investment vehicles, although most of it would be equities at this stage. Since October 2020, I've sold most of my unit trust and moved my funds to either ETF or direct stocks as part of my cost-efficiency strategy and there have already been a few posts written on this topic, feel free to check it out!
I usually don't talk much about my EPF Portfolio as I treat this completely as my "bonus fund" during my retirement years, and also largely because I have almost zero control over the fund itself - both performance or decision-wise.
I will be attempting to update this page at least once every quarter to show the latest Year-to-Date (YTD) Snapshots. Additionally, for every year that has ended, I will be retaining the historical snapshots ending December to capture the key milestones of the year. On this page, you will only find worthy mentions for the year, so if you'd like to know what happened in a more granular fashion, be sure to check out my Monthly Updates or Year In Reviews.
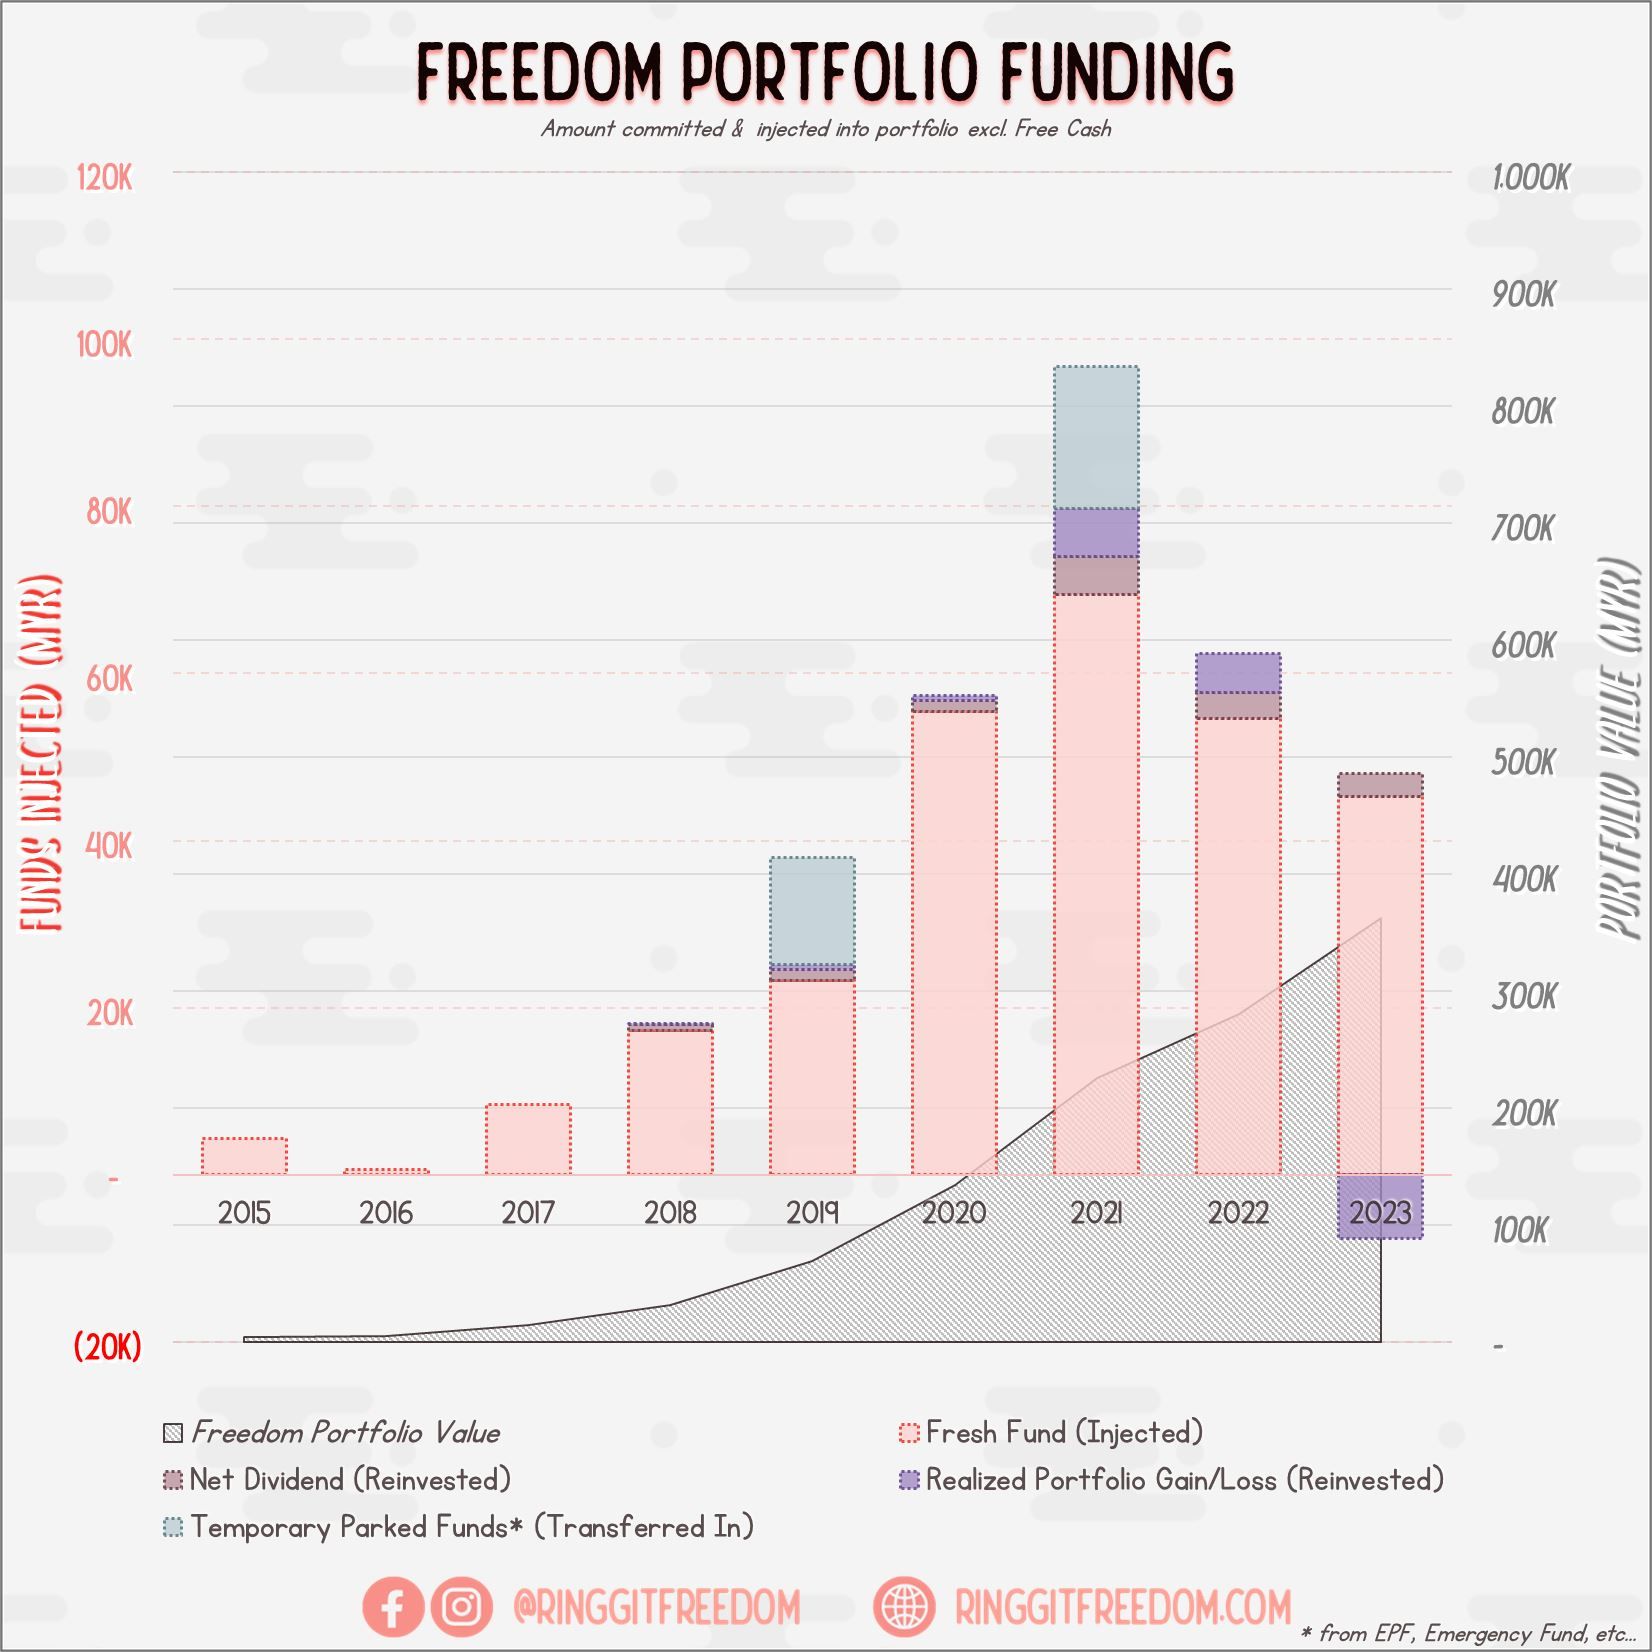
It is important to note that while there have been some organic growths of my portfolio due to the compounding effects from capital gains or dividends; most of the growth at this stage are still driven by the aggressive ramping up of my active income source and also my savings rate - and to certain extents, funding my investment through EPF withdrawal.
Below is the latest snapshot captured, showing the comparison of approximate injected funds vs. capital gains/dividends received.
I hold a long-term view (10+ years) and minimise number of trades as much as possible, except for experimental transactions where I try things out - such as mixing in a very small amount of single-stock picks or experimental ETFs. But in general, I take a very laid-back/passive investing approach and most of my investment, in the long run, will be held in VWRA domiciled in Ireland.
Whilst you will need to study and make decisions on how your investment style should be, I decided to utilise VWRA as my primary choice of ETF for the following reasons
Of course, there will come a time where I want to have higher exposure in certain countries / emerging markets/speciality funds to help me to maintain my ideal portfolio ratio (e.g. f I needed Greater China exposure, I have my China ETF 3040.HK or Hang Seng Technology 3067.HK)
To track my investment portfolio, I am still using my good ol' excel which you can get it here for free. Before proceeding further I thought it would be good if I clarified my terminologies to avoid potential confusions or misinterpretations.
My cash pile is growing, but yet I have lost the courage to go all-in equities unlike in the past. Why?
Sold (Retired) Portfolio (accumulative)
IRR: 1.83%
ROI: 2.62%
Profit/Loss: RM5,012.29
Active (Invested) Portfolio
IRR: 4.87%
ROI: 7.25%
Profit/Loss: RM32,906.36
True Cost: RM420,145.23
Total Value: RM512,575.98
Entrance Value: RM401,376.05
Portfolio Value: RM440,655.68
Nett Dividend (2024): RM653.62
Read more: 2023 in Review: Slowing Down Actually Took Me Further
I seem to be progressing well towards my goal, but will things stay the same or things are about to change soon? Is a global financial crisis imminent? I don't know. I wish I knew.
Sold (Retired) Portfolio (accumulative)
IRR: 5.43%
ROI: 9.01%
Profit/Loss: RM13,243.19
Active (Invested) Portfolio
IRR: 0.03%
ROI: 0.02%
Profit/Loss: RM219.02
True Cost: RM352,899.16
Total Value: RM394,289.13
Entrance Value: RM347,940.13
Portfolio Value: RM362,736.81
Nett Dividend (2023): RM2,723.33
Read more: 2022 in Review: An Autopilot Year
The endemic, or the beginning of a new crisis?
Sold (Retired) Portfolio (accumulative)
IRR: 6.85%
ROI: 10.73%
Profit/Loss: RM11,703.74
Active (Invested) Portfolio
IRR: -(4.19%)
ROI: -(5.22%)
Profit/Loss: -(RM16,876.40)
True Cost: RM293,679.22
Total Value: RM308,843.80
Entrance Value: RM285,171.95
Portfolio Value: RM279,999.29
Nett Dividend (2022): RM3,046.96
Read more: 2021 in Review: A Little Too Soon?
Time really flies - it was as if last month we were still counting down to welcome the new year of 2021 and it's already almost half the year gone now, and we're still stuck with battling COVID-19. Perhaps it is because of that, my mental state deteriorated further especially in April and I'm doing things my way to avoid the big fall again, just as what happened 2 years ago.
Thanks to the i-Sinar and i-Citra initiative, I have also accessed my Account 1 funds and redirected them into my personal "freedom" portfolio by increasing my exposure into both US and China respectively - to reduce my exposure to the Malaysia market mainly driven by EPF funds. Even after diverting into my personal portfolio, Malaysia is still my highest Country Exposure due to the sheer size of the EPF fund.
The never-ending crashes of China is greatly impacting my portfolio's return in the short-to-mid term and I expect it to continue for the next 12-18 months at least.
Sold (Retired) Portfolio (accumulative)
IRR: 7.38%
ROI: 11.29%
Profit/Loss: RM6,829.46
Active (Invested) Portfolio
IRR: 7.69%
ROI: 9.56%
Profit/Loss: RM21,269.55
True Cost: RM221,028.59
Total Value: RM242,400.60
Entrance Value: RM197,222.27
Portfolio Value: RM225,321.65
Nett Dividend (2021): RM4,372.53
Read more: 2020 in Review: A Year After Restarting My Financial Journey
This year, I made another leap with the opening of IBKR account (via TradeStation Global) which hopefully will fuel my shift focus from unit trust + individual stocks picking (which most did not turn out well) into passive investment strategy (mainly via ETF & StashAway) whilst keeping my costs low; but still cherry-picking a few long-term stocks here and there.
With COVID-19 and the depressed market, I honestly am not sure how things will turn out in coming years but one thing for sure - I just have to sit tight and stick with my principles. We'll see how things turn out when I revisit this post few years down the road 🙂
Sold (Retired) Portfolio (accumulative)
IRR: 2.15%
ROI: 4.08%
Profit/Loss: RM1,293.46
Active (Invested) Portfolio
IRR: 14.59%
ROI: 13.70%
Profit/Loss: RM17,330.39
True Cost: RM126,413.52
Total Value: RM143,790.38
Entrance Value: RM115,858.31
Portfolio Value: RM134,472.05
Nett Dividend (2020): RM1,439.01
The biggest game-changer this year, 3 main things that greatly altered my pace:
Sold (Retired) Portfolio (accumulative)
IRR: 6.60%
ROI: 12.34%
Profit/Loss: RM787.64
Active (Invested) Portfolio
IRR: 5.08%
ROI: 5.66%
Profit/Loss: RM3,885.63
True Cost: RM68,702.58
Total Value: RM72,588.20
Entrance Value: RM64,672.19
Portfolio Value: RM69,345.45
Nett Dividend (2019): RM1,352.67
Sold (Retired) Portfolio (accumulative)
IRR: 2.30%
ROI: 4.01%
Profit/Loss: RM172.05
Active (Invested) Portfolio
IRR: 1.52%
ROI: 1.34%
Profit/Loss: RM439.52
True Cost: RM32,686.52
Total Value: RM33,126.04
Entrance Value: RM30,654.39
Portfolio Value: RM31,265.96
Nett Dividend (2018): RM692.00
Unfortunately, I did not capture a snapshot as of December so this would be the last possible month I can go back to. Most of these portfolios were held since 2014/2015 and I have never sold any portion (nor have I convinced myself to embrace higher risk / lower cost vehicles) so this would be my oldest snapshot in this blog.
Except for RM3000/annum onto PRS funds, all fundings to my portfolio stopped by end of 2015, again due to reasons previously shared. So technically speaking, between end of 2015 till end of 2017, my portfolio investment ("true cost") merely grew by approx RM6000 (facepalm).
Active (Invested) Portfolio
IRR: 12.96%
ROI: 15.47%
Profit/Loss: RM2,144.14
True Cost: RM13,859.71
Total Value: RM16,003.85
Entrance Value: RM12,651.95
Portfolio Value: RM14,831.03
Nett Dividend (2017): nil
If you are truly curious about my portfolios back in 2014/2015, the above sheets will give you the answer. Just look at the "investment horizon" and guesstimate from there but I've captured some high level numbers below
Same thing with 2017 - the closest end-of-year snapshot I've got is November 2016.
Active (Invested) Portfolio
IRR: 5.50%
ROI: 8.67%
Profit/Loss: RM425.10
True Cost: RM4,903.53
Total Value: RM5,328.63
Entrance Value: RM4,867.34
Portfolio Value: RM5,325.10
Nett Dividend (2016): nil
Active (Invested) Portfolio
IRR: 4.85%
ROI: 3.69%
Profit/Loss: RM160.47
True Cost: RM4,351.44
Total Value: RM4,511.91
Entrance Value: RM4,317.34
Portfolio Value: RM4,510.47
Nett Dividend (2015): nil
Between when I first started working in late 2013 and till the end of 2014, I've only been savings and the max I've gone was Fixed Deposit promotions so I didn't track my portfolio back then. Heck, I considered those more as an Emergency Fund than a portfolio.
- END OF PORTFOLIO -